
Enhanced efficiency nitrogen is sold on a promise of protection: less loss, more nitrogen reaching the crop, the same yield from less product or a better yield from the same. Every one of those claims can be tested on a farm, and almost every on-farm test of them is arranged in a way that produces an answer nobody should trust.
The usual arrangement is two strips side by side, one with the product and one without, harvested and compared. That design confounds the treatment with the position in the field, has no replication, and cannot separate a real effect from soil variation that was there before the trial began. It is a demonstration, not an experiment. A trial that can support a decision costs perhaps fifteen per cent more to run and produces a result that survives a second season.
Start with the question
A trial has to answer one question, stated before the design is fixed. "Does this product increase maize yield" is too broad, because the answer depends on whether the field was losing nitrogen and by which pathway. "Does urea treated with an NBPT urease inhibitor, surface-applied and not incorporated, produce more grain than untreated urea on this field in a season with more than fifty millimetres of rain in the two weeks after application" is a question a trial can answer.
The question determines the treatments, the measurements and the length of the trial. If the claim is about yield, the trial needs enough replication to detect the yield difference that would justify the product cost. If the claim is about nitrogen loss, it needs measurements of loss, not just yield, because a season without loss will show no yield difference even where the product worked exactly as designed.
Replication, randomisation, blocking
Replication is what allows a difference to be separated from noise. A treatment applied once has one observation, and one observation cannot be distinguished from the particular patch of soil it happened to occupy. Three or four replicates is the practical minimum for on-farm work, and more is better where the field is variable.
Randomisation protects against bias. If the treated strips are always nearest the road, or always applied first, the treatment is confounded with position or with operator fatigue. Allocating treatments to plots with a random number sequence rather than a convenient pattern costs nothing and removes a whole class of error.
Blocking controls the variation that cannot be removed. The field is divided into blocks running across the direction of the known variation, so each block contains a full set of treatments on similar ground. A field that slopes from a ridge to a depression should have blocks running up and down the slope, so each experiences the full range and the slope effect drops out of the comparison. This is the randomised complete block design, and it remains the workhorse of field experimentation.
Plot size and machine reality
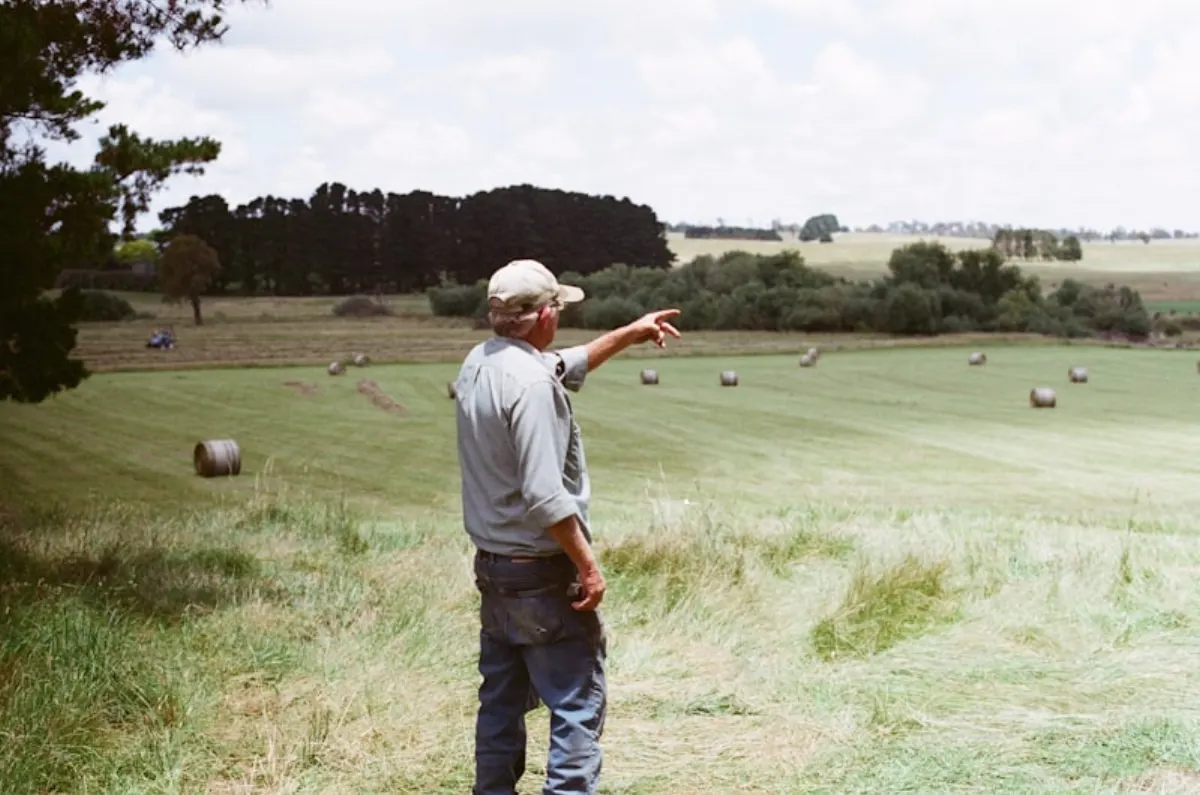
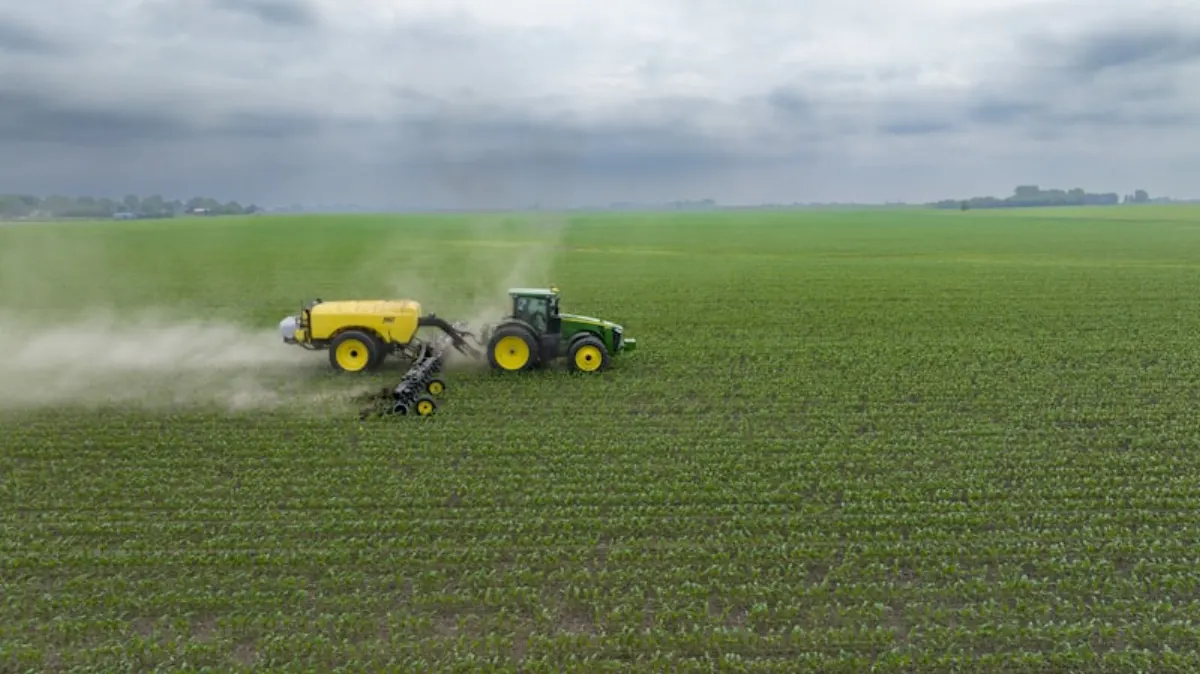
Plots have to be big enough for the machinery to apply the treatment properly and for the harvester to measure it without contamination from the neighbours. A working rule is at least two passes of the applicator wide, and long enough for one full pass of the harvester plus a discard at each end. For broadacre maize that usually means ten to thirty metres wide and thirty to a hundred metres long.
The ends of every plot are the weakest part. Machines accelerate and decelerate there, spread patterns overlap, and the harvester takes time to fill and empty. Discarding a headland strip from each end, and trimming the first and last few metres from the harvested area, removes a systematic bias that otherwise favours whichever treatment sits at the field edge. Where a full randomised design is impractical, strip trials with three or four randomised replicates per treatment are a reasonable compromise, provided yield is measured plot by plot rather than from one weighbridge ticket for the whole strip.
What to measure and when
Yield is the measurement that decides the commercial question, and it has to survive scrutiny: weigh each plot separately, measure grain moisture at the same time, and report yield at a standard moisture content. Comparing fresh weights between plots harvested at different moisture contents is one of the most common errors in on-farm work.
| Measurement | When | What it answers |
|---|---|---|
| Soil nitrate and ammonium, 0-60 cm | Before application and after harvest | Whether nitrogen was retained or lost from the profile |
| Tissue nitrogen at silking | Silking | Whether the crop had more nitrogen available |
| Canopy sensing | Several times through the season | When and whether the difference developed |
| Plot grain weight and moisture | Harvest | The commercial result, at standard moisture |
| As-applied records | Every pass | Whether the intended rate and product were applied |
Supporting measurements explain the result. Tissue nitrogen at silking shows whether the crop actually had more nitrogen available, canopy sensing shows whether the difference appeared during the season or only at harvest, and soil nitrate before application and after harvest shows whether nitrogen remained in the profile. Where the purpose is to demonstrate reduced loss, ammonia or nitrous oxide measurements are needed, and those require specialist equipment and a much larger budget.
Reading the result
A difference between treatment means is not yet a result. It has to be compared with the variability within the trial. The least significant difference combines the within-treatment variation, the number of replicates and the chosen confidence level into one number, and only differences larger than it can be treated as real.
The arithmetic is worth seeing once, because it sets expectations. Take a maize trial where the coefficient of variation for yield is ten per cent and the mean is ten tonnes per hectare, typical for a well-run small plot trial. With four replicates of four treatments, the least significant difference at the five per cent level works out at about 1.7 tonnes per hectare, or seventeen per cent of the mean. A product that delivers a five per cent gain cannot be detected by that design, however real the gain is.
| Replicates | Detectable difference, CV 10% | Detectable difference, CV 15% |
|---|---|---|
| 3 | about 20% | about 30% |
| 4 | about 17% | about 26% |
| 6 | about 12% | about 18% |
| 8 | about 10% | about 15% |
This is why so many on-farm trials of enhanced efficiency products are inconclusive. The effects being sought are often three to ten per cent, while the designs being used can only resolve differences of fifteen to thirty per cent. The honest conclusion from such a trial is not that the product failed, but that the trial could not see the answer. Reducing the coefficient of variation, by careful plot management and by measuring yield accurately plot by plot, is often worth more than adding replicates.
Common mistakes
The first is comparing different nitrogen rates while claiming to compare products. If the treated strip received more nitrogen, or was applied at a different time, the trial cannot separate the product from the rate or the timing. The second is harvesting with a machine that mixes grain across plots, because a combine with a large tank and a slow response to plot changes carries grain from one plot into the next. Short plots need discarding and long plots trimming, or the trial should be harvested with a weigh trailer.
The third is drawing conclusions from one site and one season. Enhanced efficiency products are insurance against loss, and insurance only pays in the years when the loss occurs. A single dry season will show nothing and a single wet season may show everything; only two or three seasons across more than one site describe the product's behaviour.
Reporting a credible result
A credible report states the question, the design, the number of replicates, the treatments with their rates and timings, the soil and weather of the season, the measurements taken and the statistical treatment applied. It reports the least significant difference alongside the means, so a reader can see whether a difference is meaningful, and it states the coefficient of variation, which is the best single indicator of whether the trial was well run. It also reports what did not work: a trial that found no difference in a dry season is a useful data point, particularly where the same product showed a gain in a wet season at the same site.
Common questions
How many replicates do I really need? Four is the practical minimum for a yield comparison and six is better where the field is variable. If the expected effect is small, no affordable number will detect it, and the trial should measure loss or nitrogen uptake instead of yield.
Can I run a trial with the farmer's own equipment? Yes, and it is preferable, because it tests the product in the conditions where it will be used. The design has to accommodate the machinery: plots at least two applicator widths wide, ends discarded, yield measured plot by plot.
Should I include a zero-nitrogen plot? It shows what the soil supplies and puts the response in context. It costs one plot per block and answers whether nitrogen was limiting at all, which is often the reason a product trial shows nothing.
How long should a trial run? At least two seasons, ideally three, across more than one site. One season describes the weather, not the product.
- Gomez, K.A. and Gomez, A.A. (1984). Statistical Procedures for Agricultural Research, 2nd edition. Wiley.
- Piepho, H.-P. et al. (2013). Statistical aspects of on-farm experimentation. Crop and Pasture Science 64: 1031-1042.
- International Plant Nutrition Institute. 4R Plant Nutrition Manual, section on field experimentation.
- Akiyama, H., Yan, X. and Yagi, K. (2010). Evaluation of effectiveness of enhanced-efficiency fertilizers: meta-analysis. Global Change Biology 16: 1837-1846.
Recommendations depend on local soil, climate and crop conditions. Follow the product label and local regulations, and consult a qualified agronomist for field decisions.