
Soil sampling has two jobs that are often confused. The first is to find out what a field contains, which a single well-taken composite can do. The second is to find out where within the field the content differs, which a single composite cannot do at all. Variable-rate fertilizer needs the second answer, and producing it is a design problem rather than a laboratory one.
The management zone is the working unit that resolves the problem. A zone is an area inside a field that is uniform enough to receive one rate, defined by evidence about the soil rather than by drawing lines on a map, and sampled as a unit so the result describes the area rather than a single point in it. This article sets out how such zones are built, how many samples they need, and how to tell whether a zone map is telling the truth.
What a management zone is
A management zone is not the same thing as a grid cell. A grid cell is an arbitrary square, and its value is whatever the sample inside it happened to find, including the sampling error. A zone is an interpretation: it groups ground that behaves similarly because it shares texture, depth, drainage, slope or history, so that a single rate makes sense across the whole of it.
That distinction has a practical consequence. Grid sampling at a fixed density produces a map that always looks complete, even when the density is far too low for the variability present, and the interpolation between points invents smooth gradients that the field may not contain. Zone sampling accepts that the field has structure, and spends its sampling budget on describing that structure rather than on covering space evenly.
Why uniform grids disappoint
Grid sampling is not wrong, and on small, high-value blocks it is often the best available approach. It disappoints at broadacre scale for an arithmetic reason. To detect a difference between two neighbouring cells, the sampling intensity has to be high enough that the difference exceeds the combined sampling and analytical error. At one sample per hectare, much of the pattern visible on the resulting map is noise, and the prescription built on it varies the rate for reasons that will not repeat next season.
Zone sampling addresses this by reducing the number of units that need to be distinguished and increasing the number of cores inside each one. Twelve cores composited across a four-hectare zone give a far more reliable estimate of that zone than one core in each of four one-hectare cells gives of each cell, even though both use the same number of cores. Precision about a place is worth more than the illusion of precision everywhere, provided the places are real.
Assembling the layers
Zones are built from layers that describe the field's capacity to supply water and nutrients. Yield maps from three or more seasons show where the crop actually performed, and the stable pattern across those seasons is more informative than any single year. Apparent electrical conductivity, measured on the move or by a handheld instrument, responds mainly to clay content, moisture and salinity, and therefore maps the soil's physical template. Elevation and slope, derived from a survey-grade receiver or a drone, describe where water collects and where topsoil has been lost.
Soil survey information, historical field boundaries, manure history and the grower's own recollection of problem patches are all legitimate layers, and the last of these is often the most valuable because it carries decades of observation that no sensor records. Aerial or satellite imagery of bare soil adds a view of surface texture and residue cover, and in-season imagery adds a view of crop vigour that can be checked against the yield history.
| Layer | What it shows | How to use it | Main caveat |
|---|---|---|---|
| Multi-year yield maps | Where the crop performed, consistently | Defines the zones that matter agronomically | Confounded by drainage, pests and harvest errors |
| Apparent electrical conductivity | Clay content, moisture, salinity | Maps the physical template of the field | Responds to moisture at the time of survey |
| Elevation and slope | Water movement and erosion patterns | Explains why the template is what it is | Needs a survey-grade source to be useful |
| Bare-soil imagery | Texture, residue cover, old boundaries | Confirms and refines the zone edges | Cloud and timing dependent |
| Grower knowledge | Problem patches, history, drainage works | Tests the map against reality | Not recorded, so easily lost |
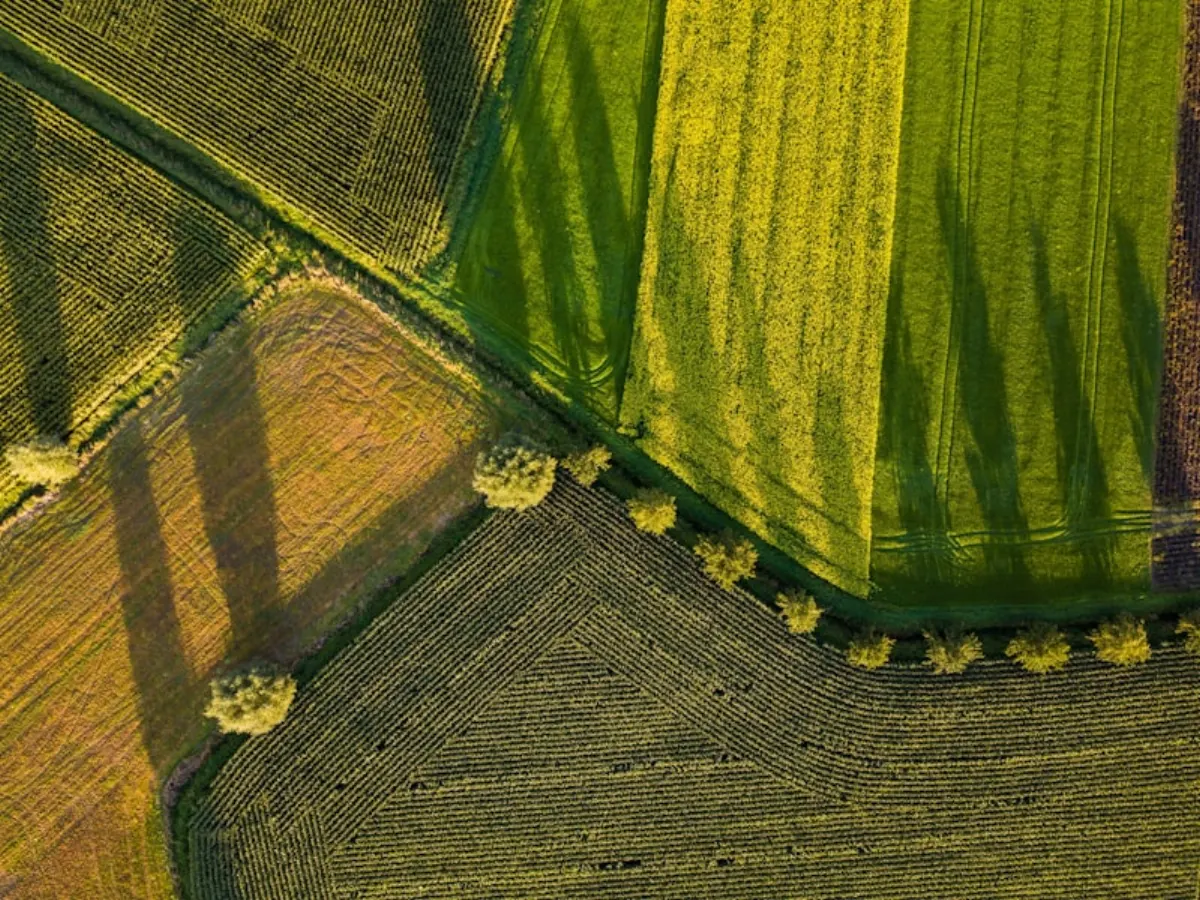
Clustering into three to five zones
The layers are combined by clustering, which groups pixels or grid cells with similar values across all the layers at once. The output is a small number of classes, and the practical rule is to keep the number low. Three to five zones can be described, sampled, prescribed and explained; fifteen cannot. A map with many classes usually reflects the algorithm's sensitivity rather than the field's structure.
Cluster output also has to be edited. Algorithms produce smooth blobs with rounded edges that cross headlands, cut through drainage channels and ignore the gate the sprayer has to drive through. A zone map that cannot be applied is not a zone map. The final version should be simplified so that each zone is at least as wide as the spreader or boom can handle, and so that its boundaries follow features the operator can see.
Where the layers disagree, the yield history should usually win, because the purpose of the map is to explain yield. If conductivity says one thing and ten years of yield maps say another, the conductivity is describing the soil and the yield maps are describing the outcome, and the outcome is what the prescription is trying to change.
Sampling inside each zone
Once the zones exist, each one is sampled as a unit. The standard approach is to walk or drive a pattern that covers the zone, take eight to fifteen cores to a consistent depth, and composite them into one sample per zone. Cores should avoid headlands, tracks, gateways, dung pats and obvious problem spots, because those are not representative of the zone.
Depth discipline matters more than most sampling protocols admit. A core that is twenty centimetres deep in one part of the zone and twenty-five in another mixes two different soil layers and biases the result for phosphorus and potassium, which are stratified near the surface under minimum tillage. A depth guide, used consistently, removes a large and invisible source of error.
Each zone sample should be georeferenced at its centre and the sampling route recorded, so the same zone can be resampled in the next cycle. Where a zone is large or internally variable, splitting it into two sampling units within the same management class is a reasonable compromise: the prescription stays simple while the estimate becomes more defensible.
Validating and maintaining
A zone map is a hypothesis, and it should be tested within the first season. The cheapest test is to compare yields in the zones against the rates applied and ask whether the pattern held. A stronger test is to leave a uniform-rate strip through the field and compare it with the prescription over the same ground; that strip is the evidence that the zones were worth following.
Zones are not permanent. Phosphorus and potassium zones often survive three to five years; nitrogen zones rarely survive a season. Rebuilding on the sampling cycle is sensible for the stable nutrients, and re-examining the yield history when a new field is added is essential, because a map built on another farm's structure will not transfer. The zones should also be revisited whenever drainage is installed, a fence line is removed, or the rotation changes enough to alter how the field performs.
Common questions
How many zones should a field have? Three to five is the practical range. Fewer cannot express the variation, more cannot be applied or explained. A field with genuinely uniform soil needs one zone, and that is a valid answer.
Can I build zones without yield maps? Yes, using conductivity, elevation and soil survey information, but the result is a soil map rather than a productivity map, and it should be checked against the grower's experience before it drives a rate.
How often should zones be resampled? For phosphorus, potassium and pH, every three to five years matches the normal soil test cycle. For nitrogen, zones are a poor basis and should be replaced by in-season information.
Is zone sampling cheaper than grid sampling? Usually, because fewer laboratory analyses are needed for the same number of cores. The saving is in the laboratory bill, not in the field time, since walking a zone takes as long as walking a grid.
- Mulla, D.J. (2013). Twenty five years of remote sensing in precision agriculture. Biosystems Engineering 114: 358-371.
- Hedley, C. (2015). The role of precision agriculture for improved nutrient management on farms. Journal of the Science of Food and Agriculture 95: 12-19.
- Lowenberg-DeBoer, J. and Erickson, B. (2019). Setting the record straight on precision agriculture adoption. Agronomy Journal 111: 1552-1569.
- FAO. Soil testing and plant analysis in support of sustainable soil management.
- International Plant Nutrition Institute. 4R Plant Nutrition Manual, latest edition.
Recommendations depend on local soil, climate and crop conditions. Follow the product label and local regulations, and consult a qualified agronomist for field decisions.